Timeline Infographics
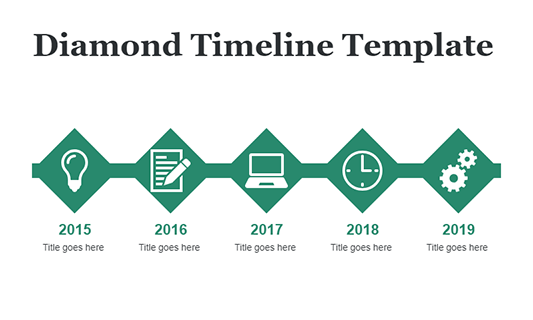
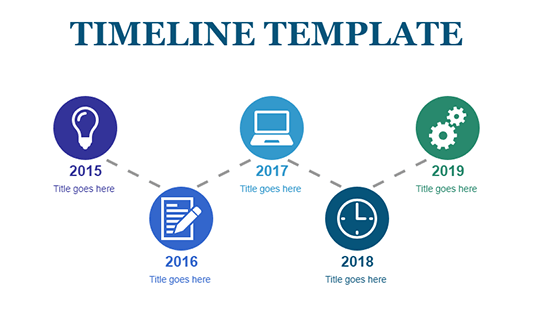
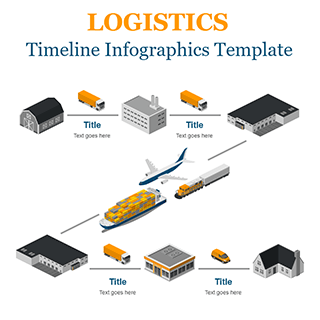
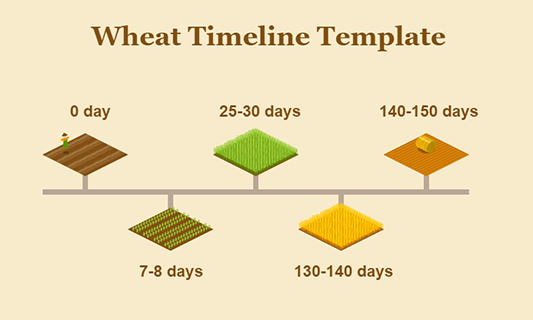
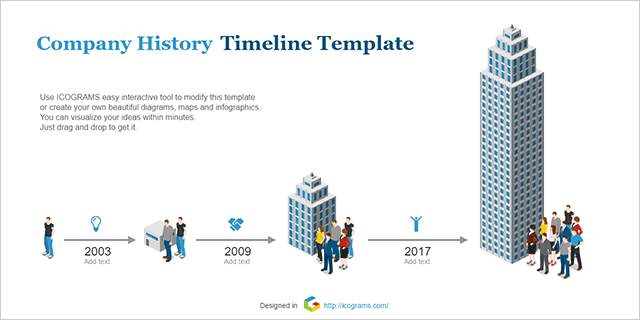
Timeline infographics are an effective way to visualize the history of something and to give an overview of events.
Our unique online designer with thousands of icons allows to create illustrations by yourself. It's easy and free to try.
What you can create using Icograms Designer
Timeline infographic is one of the most popular formats in financial reports, strategic reports, and presentations.
It may visualize past and future events like financial reports and growth, historical events for the past, and project milestones, strategic planning, for the future.
How to work with Icograms Designer
You can start your project from scratch or customize one of our templates.
To get started from scratch
- Open Icograms Designer
- Drag and drop icons to the work area
- Utilize clone tools and copy/paste functions to increase efficiency
- Move, resize, and recolor icons to find the best solution
- Add text and symbols to enhance your design.
- Upload your own graphics if needed
- Export the created graphics
To get started from a template
- Choose a suitable template
- Drag and drop additional graphics if necessary
- Insert your own text using text boxes
- Customize your design by changing colors, fonts, and icons
- Upload your own graphics if needed
- Export the created graphics
